| MSI R6870 Radeon HD 6870 Video Card |
| Reviews - Featured Reviews: Video Cards | ||||||||||||||||||||||||||||||||||||||||||||||||||||||||||||||||||||||||||||||||||||||||||||||||||||||||||||||||||||||||||||||||||||||||||||||||||||||||||||||||||||||||||||||||||||||||||||||||||||||||||||||||||||||||||||||||||||||||||||||||||||||||||||||||||||||||||||||||||||||||||||||||||||||||||||||||||||||||||||||||||||||||||||||||||||||||||||||||||||||||||||||||||||||||||||||||||||||||||||||||||||||||||||||||||||||||||||||||||||||||||||||||||||||||||||||||||||||||||||||||||||||||||||||||||||||||||||||||||||||||||||||||||||||||||||||||||||||||||||||||||||||||||||||||||||||||||||||||||||||||||||||||||||||||||||
| Written by Bruce Normann | ||||||||||||||||||||||||||||||||||||||||||||||||||||||||||||||||||||||||||||||||||||||||||||||||||||||||||||||||||||||||||||||||||||||||||||||||||||||||||||||||||||||||||||||||||||||||||||||||||||||||||||||||||||||||||||||||||||||||||||||||||||||||||||||||||||||||||||||||||||||||||||||||||||||||||||||||||||||||||||||||||||||||||||||||||||||||||||||||||||||||||||||||||||||||||||||||||||||||||||||||||||||||||||||||||||||||||||||||||||||||||||||||||||||||||||||||||||||||||||||||||||||||||||||||||||||||||||||||||||||||||||||||||||||||||||||||||||||||||||||||||||||||||||||||||||||||||||||||||||||||||||||||||||||||||||
| Friday, 05 November 2010 | ||||||||||||||||||||||||||||||||||||||||||||||||||||||||||||||||||||||||||||||||||||||||||||||||||||||||||||||||||||||||||||||||||||||||||||||||||||||||||||||||||||||||||||||||||||||||||||||||||||||||||||||||||||||||||||||||||||||||||||||||||||||||||||||||||||||||||||||||||||||||||||||||||||||||||||||||||||||||||||||||||||||||||||||||||||||||||||||||||||||||||||||||||||||||||||||||||||||||||||||||||||||||||||||||||||||||||||||||||||||||||||||||||||||||||||||||||||||||||||||||||||||||||||||||||||||||||||||||||||||||||||||||||||||||||||||||||||||||||||||||||||||||||||||||||||||||||||||||||||||||||||||||||||||||||||
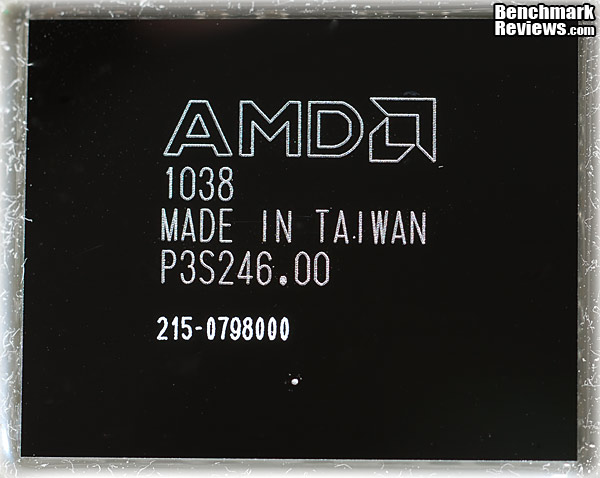
MSI R6870 Video Card ReviewAMD's first video card in the new HD 6xxx series occupies a brand new position in the product hierarchy. The HD 5830 GPU only made economic sense if you had awful yields at the wafer fab, and the Cypress chip, with 334 square millimeters of silicon, is way too big for just 1120 shaders and 16 ROPS. The new Barts GPU uses just 255 mm2 to do the same job only better, with twice the number of ROPs. Although AMD was denied the opportunity to roll out 32nm-based chips for this product cycle, they were able to go back to the drawing board with relaxed design rules for the 40nm process at TSMC. With one full year of volume production under their belts, they optimized this latest generation of GPUs for the current, actual manufacturing constraints. In the first iteration, they had to use estimates for defect density, maximum L/D ratios, and a whole host of other design guidelines that are supposed to ensure you get usable chips at the end of the production line. AMD did a better job of interpreting the rule book last product cycle, and as a result their full line of 40nm chips was first out of the gate, and stayed out in front for a full 6 months.
NVIDIA launched the GTX460 about four months ago, and it has been the darling of the gaming community since then. With performance per mm2 and performance per watt numbers that put the first Fermi chips to shame, it deserves all the success it has enjoyed. It's also an amazing overclocker, so its performance profile is a bit hard to pin down; it's a moving target from a marketing perspective. Into this victory celebration, the AMD HD 6870 steps forward like the "Boy Named Sue" in the infamous Johnny Cash song. Everyone seems to have massive heartburn over the product numbering scheme that AMD introduced with the new 68xx cards. The fact that AMD has successfully introduced an addition class of GPU (as defined by die size), to fill the product gap everyone complained about with the 5xxx series, seems to have been overlooked by all. Something had to give, and it was the auspicious title of HD x8x0 that got handed down from the previous King to the new Crown Prince. You may have seen some benchmarks for the Radeon HD 6870 already, but let's take a complete look, inside and out, at the MSI R6870-2PM2D1GD5. Then we'll run it through Benchmark Review's full test suite. We're going to look at how this reference card performs with a standard 900 MHz factory clock on the graphics core; I want to wait until voltage adjustment becomes available before I report on its overclocking ability. I think you have to allow increased core voltage to find out how this GPU really compares to the GF104. That GPU won at least half of its acclaim from folks using MSI Afterburner to turn up the wick on all those reference cards, so it seems fair to wait until that capability is available for the HD 6870.
Manufacturer: Micro-Star Int'l Co., Ltd Full Disclosure: The product sample used in this article has been provided by MSI. AMD Radeon HD 6870 GPU FeaturesThe AMD Radeon HD 6870 GPU contained in the MSI R6870 card has all of the major technologies that the Radeon 5xxx cards have had since last September. AMD has added several new features, however. The most important ones are: the new Morphological Anti-aliasing, the two DisplayPort 1.2 connections that support four monitors between them, 3rd generation UVD video acceleration, and AMD HD3D technology. In case you are just starting your research for a new graphics card, here is the complete list of GPU features, as supplied by AMD:
AMD RadeonTM HD 6870 GPU Feature Summary:
Now, here are the usual disclaimers: 2010 Advanced Micro Devices, Inc. All rights reserved. AMD, the AMD Arrow logo, Catalyst, CrossFireX, PowerPlay, Radeon and combinations thereof are trademarks of Advanced Micro Devices, Inc. Microsoft, Windows, Windows Vista, and DirectX are registered trademarks of Microsoft Corporation in the U.S. and/or other jurisdictions. PCI Express is a registered trademark of PCI-SIG. Other names are for informational purposes only and may be trademarks of their respective owners. Additional hardware (e.g. Blu-ray drive, HD or 10-bit monitor, TV tuner) and/or software (e.g. multimedia applications) are required for the full enablement of some features. Not all features may be supported on all components or systems - check with your component or system manufacturer for specific model capabilities and supported technologies.
AMD Radeon HD 6870 GPU Detail SpecificationsGPU Engine Specs: |
||||||||||||||||||||||||||||||||||||||||||||||||||||||||||||||||||||||||||||||||||||||||||||||||||||||||||||||||||||||||||||||||||||||||||||||||||||||||||||||||||||||||||||||||||||||||||||||||||||||||||||||||||||||||||||||||||||||||||||||||||||||||||||||||||||||||||||||||||||||||||||||||||||||||||||||||||||||||||||||||||||||||||||||||||||||||||||||||||||||||||||||||||||||||||||||||||||||||||||||||||||||||||||||||||||||||||||||||||||||||||||||||||||||||||||||||||||||||||||||||||||||||||||||||||||||||||||||||||||||||||||||||||||||||||||||||||||||||||||||||||||||||||||||||||||||||||||||||||||||||||||||||||||||||||||


|
Graphics Card |
Cores |
Core Clock |
Shader Clock |
Memory Clock |
Memory |
Interface |
| ATI Radeon HD 5770 (Engineering Sample) |
800 |
850 |
N/A |
1200 |
1.0GB GDDR5 |
128-bit |
| XFX Radeon HD 5830 (HD-583X-ZNFV) |
1120 |
800 |
N/A |
1000 |
1.0GB GDDR5 |
256-bit |
|
ASUS GeForce GTX 260 (ENGTX260 MATRIX) |
216 |
576 |
1242 |
999 |
896MB GDDR3 |
448-bit |
| MSI GeForce GTX 460 (N460GTX Cyclone 1GD5/OC) |
336 |
725 |
1450 |
900 |
1.0 GB GDDR5 |
256-bit |
|
MSI Radeon HD 6870 (R6870-2PM2D1GD5) |
1120 |
900 |
N/A |
1050 |
1.0GB GDDR5 |
256-bit |
|
PowerColor Radeon HD 5870 (PCS+ AX5870 1GBD5-PPDHG2) |
1600 |
875 |
N/A |
1250 |
1.0GB GDDR5 |
256-bit |
- ASUS GeForce GTX 260 (ENGTX260 MATRIX - Forceware v260.89)
- ATI Radeon HD 5770 (Engineering Sample - Catalyst 8.782.0.0)
-
XFX Radeon HD 5830 (HD-583X-ZNFV - Catalyst 8.782.0.0)
-
MSI GeForce GTX 460 (N460GTX Cyclone 1GD5/OC - Forceware v260.89)
- MSI Radeon HD 6870 (R6870-2PM2D1GD5 - Catalyst 8.782.0.0)
-
PowerColor Radeon HD 5870 (PCS+ AX5870 1GBD5-PPDHG2 - Catalyst 8.782.0.0)
3DMark Vantage Performance Tests
3DMark Vantage is a computer benchmark by Futuremark (formerly named Mad Onion) to determine the DirectX 10 performance of 3D game performance with graphics cards. A 3DMark score is an overall measure of your system's 3D gaming capabilities, based on comprehensive real-time 3D graphics and processor tests. By comparing your score with those submitted by millions of other gamers you can see how your gaming rig performs, making it easier to choose the most effective upgrades or finding other ways to optimize your system.
There are two graphics tests in 3DMark Vantage: Jane Nash (Graphics Test 1) and New Calico (Graphics Test 2). The Jane Nash test scene represents a large indoor game scene with complex character rigs, physical GPU simulations, multiple dynamic lights, and complex surface lighting models. It uses several hierarchical rendering steps, including for water reflection and refraction, and physics simulation collision map rendering. The New Calico test scene represents a vast space scene with lots of moving but rigid objects and special content like a huge planet and a dense asteroid belt.
At Benchmark Reviews, we believe that synthetic benchmark tools are just as valuable as video games, but only so long as you're comparing apples to apples. Since the same test is applied in the same controlled method with each test run, 3DMark is a reliable tool for comparing graphic cards against one-another.
1680x1050 is rapidly becoming the new 1280x1024. More and more widescreen are being sold with new systems or as upgrades to existing ones. Even in tough economic times, the tide cannot be turned back; screen resolution and size will continue to creep up. Using this resolution as a starting point, the maximum settings were applied to 3DMark Vantage include 8x Anti-Aliasing, 16x Anisotropic Filtering, all quality levels at Extreme, and Post Processing Scale at 1:2.
3DMark Vantage GPU Test: Jane Nash
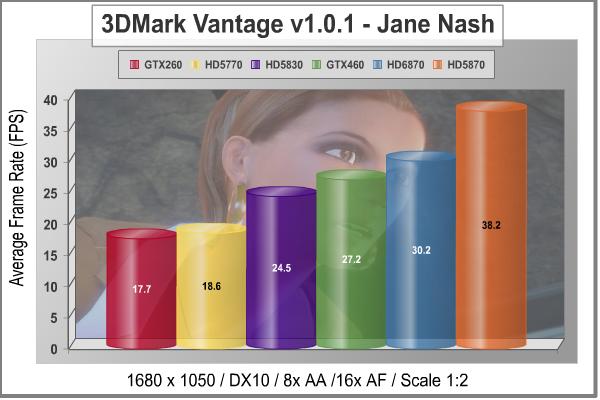
Our first test shows the HD 6870 clearly besting the HD 5770 and HD 5830 parts. This "replacement" card does quite a bit more than fill the same slot occupied by the older models. It also beats out an overclocked GTX460 by a little over 10% in this synthetic test, but its lack of shaders, compared to the HD 5870 shows all too clearly here. At least in DX10 synthetics, the 1600 stream processors of the top Cypress GPU model rule the roost.
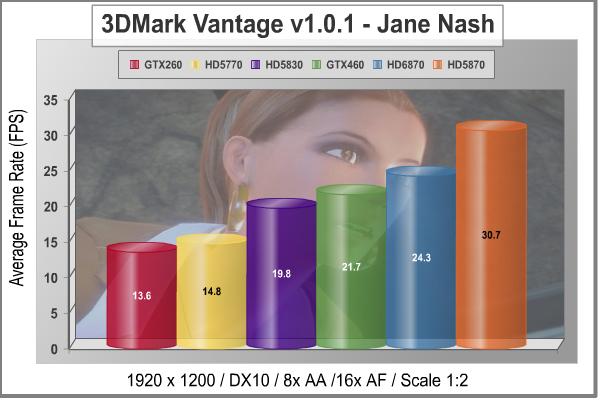
At 1920x1200 native resolution, things are much the same as the lower screen size; just the absolute values are lower, the ranking stays the same. BTW, the order of the bars, from left to right is based on current cost of the products. The exception to the rule is the GTX260 bar which is not currently in the retail channel. One thing you may have noticed is how well the HD 5830 does on this test, compared to the HD 5770. That issue has been beat to death since the 5830 was first released, but I mention it to demonstrate that this synthetic test has a way of highlighting the performance differences between those two cards that is harder to demonstrate with some other benchmarks. All the choices seem choppy at times, as none of them manages to really break free from the 30 FPS lower limit. Let's take a look at test #2, which has a lot more surfaces to render, with all those asteroids flying around the doomed planet New Calico.
3DMark Vantage GPU Test: New Calico

In the medium resolution New Calico test, the moderately overclocked MSI N460GTX Cyclone does so well that it edges out the AMD HD 6870 with its base clocks. That's an impressive feat for a card in this price range. The overclocked results show that synthetic performance scales linearly with higher clock rates, just as you would suspect. The HD 6870 retains its lead over the HD 5830 and HD 5770 that we saw in the Jane Nash test, it's just the GTX460 that seems to get a boost from this benchmark. None of the cards get over 30 FPS in this medium-resolution benchmark, which shows how tough this medium resolution test really is.

At the higher screen resolution of 1920x1200, the MSI N460GTXCyclone with its factory OC holds onto a slim lead over the HD 6870, by less than 1 frame. The fact that the 6870 and 5830 have the exact same number of stream processors (1120) seems to have little effect on the performance results. Clearly the architecture improvements have made a significant difference, and none of that difference is due to the improved tessellation engine in the new Radeon 6xxx series, as these are all DX10 tests. Even the fastest single GPU cards have trouble rendering this scene, with the top card putting up an average frame rate in the low 20s. Soon this benchmark suite may be replaced with DX11-based tests, but in the fading days of DX10 it has been a very reliable and challenging benchmark for high-end video cards.
We need to look at some actual gaming performance to verify these results, so let's take a look in the next section, at how these cards stack up in the standard bearer for DX10 gaming benchmarks, Crysis.
|
Graphics Card |
Cores |
Core Clock |
Shader Clock |
Memory Clock |
Memory |
Interface |
| ATI Radeon HD5770 (Engineering Sample) |
800 |
850 |
N/A |
1200 |
1.0GB GDDR5 |
128-bit |
| XFX Radeon HD5830 (HD-583X-ZNFV) |
1120 |
800 |
N/A |
1000 |
1.0GB GDDR5 |
256-bit |
|
ASUS GeForce GTX 260 (ENGTX260 MATRIX) |
216 |
576 |
1242 |
999 |
896MB GDDR3 |
448-bit |
| MSI GeForce GTX 460 (N460GTX Cyclone 1GD5/OC) |
336 |
725 |
1450 |
900 |
1.0 GB GDDR5 |
256-bit |
|
MSI Radeon HD6870 (R6870-2PM2D1GD5) |
1120 |
900 |
N/A |
1050 |
1.0GB GDDR5 |
256-bit |
|
PowerColor Radeon HD 5870 (PCS+ AX5870 1GBD5-PPDHG2) |
1600 |
875 |
N/A |
1250 |
1.0GB GDDR5 |
256-bit |
Crysis Performance Tests
Crysis uses a new graphics engine: the CryENGINE2, which is the successor to Far Cry's CryENGINE. CryENGINE2 is among the first engines to use the Direct3D 10 (DirectX 10) framework, but can also run using DirectX 9, on Vista, Windows XP and the new Windows 7. As we'll see, there are significant frame rate reductions when running Crysis in DX10. It's not an operating system issue, DX9 works fine in WIN7, but DX10 knocks the frame rates in half.
Roy Taylor, Vice President of Content Relations at NVIDIA, has spoken on the subject of the engine's complexity, stating that Crysis has over a million lines of code, 1GB of texture data, and 85,000 shaders. To get the most out of modern multicore processor architectures, CPU intensive subsystems of CryENGINE2 such as physics, networking and sound, have been re-written to support multi-threading.
Crysis offers an in-game benchmark tool, which is similar to World in Conflict. This short test does place some high amounts of stress on a graphics card, since there are so many landscape features rendered. For benchmarking purposes, Crysis can mean trouble as it places a high demand on both GPU and CPU resources. Benchmark Reviews uses the Crysis Benchmark Tool by Mad Boris to test frame rates in batches, which allows the results of many tests to be averaged.
Low-resolution testing allows the graphics processor to plateau its maximum output performance, and shifts demand onto the other system components. At the lower resolutions Crysis will reflect the GPU's top-end speed in the composite score, indicating full-throttle performance with little load. This makes for a less GPU-dependant test environment, but it is sometimes helpful in creating a baseline for measuring maximum output performance. At the 1280x1024 resolution used by 17" and 19" monitors, the CPU and memory have too much influence on the results to be used in a video card test. At the widescreen resolutions of 1680x1050 and 1900x1200, the performance differences between video cards under test are mostly down to the cards themselves, but there is still some influence by the rest of the system components.
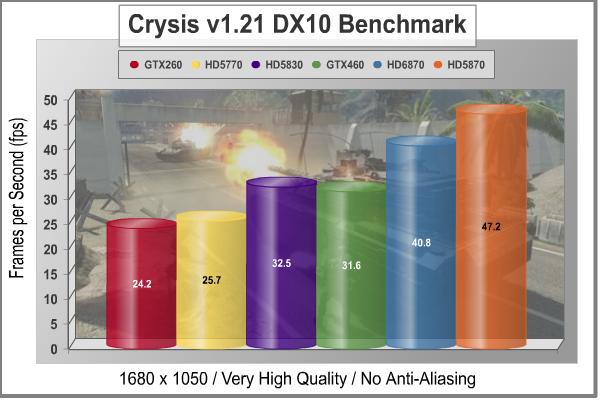
With medium screen resolution and no MSAA dialed in, the MSI R6870 is about half way between the HD 5830 and the HD 5870. Unlike many so-called TWIMTBP titles, Crysis has always run quite well on the ATI architecture, and the 6xxx series doesn't change that at all. The GTX 460 is not quite competitive here at current pricing, but don't look at the performance in this title as anything like a failure. It's just not a slam dunk victory for NVIDIA this time, unless you are looking at results for a massively overclocked version, which is always a potential threat with the GTX460.
Crysis is one of those few games that stress the CPU almost as much as the GPU. As we increase the load on the graphics card, with higher resolution and AA processing, the situation may change. Remember all the test results in this article are with maximum allowable image quality settings, plus all the performance numbers in Crysis took a major hit when Benchmark Reviews switched over to the DirectX 10 API for all our testing.

At 1900 x 1200 resolution, the relative rankings stay the same; the raw numbers just go down. With the increased load on the GPU, the R6870 still gets over the 30FPS hump, but only by about 10%. It takes more than any mid-range GPU can muster to play Crysis at high resolution with all the bells and whistles turned on, but that should be no surprise to anyone.
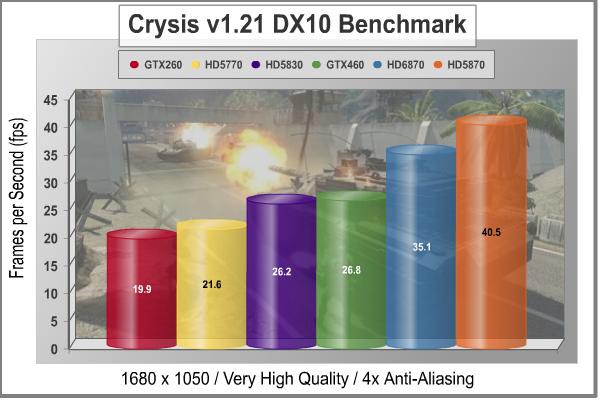
Now let's turn up the heat a bit on the ROP units, and add some Multi-Sample Anti-Aliasing. With 4x MSAA cranked in, the top cards lose about 5 FPS at 1680x1050 screen resolution but they manage to stay above the 30 FPS line. Compared to the ATI offerings, the MSI N460GTX Cyclone with out-of-the-box settings still can't convincingly edge out the HD 5830. The HD 6870 once again slots itself very nicely between the old HD 5830 and the HD 5870. Unlike the much-maligned 5830, the 6870 seems to have cleanly hit the exact middle of the performance target. I think in this case, the marketing people and the engineers had the good fortune to share a common vision about what performance was needed to kick off the new product line.

This is one of our toughest tests, at 1900 x 1200, maximum quality levels, and 4x AA. Only one GPU gets above 30 FPS in this test, and until recently it was the fastest single-GPU card on the planet, the Radeon HD 5870. In the middle ranges, the HD 6870 holds on to its spot as the performance leader, and also pushes out the GTX 460 as the value leader. Even a massive overclock on the GTX 460 won't come up even with the HD 6870 on this test. I ran the MSI GTX460 HAWK at 950 MHz core clock last month, and it only got 26 FPS at these settings.
Our next benchmark of the series is not for the faint of heart. Lions and tiger - OK, fine. Guys with guns - I can deal with that. But those nasty little spiders......NOOOOOO! How did I get stuck in the middle of a deadly fight between Aliens vs. Predator anyway? Check out the results from one of our toughest new DirectX 11 benchmarks in the next section.
|
Graphics Card |
Cores |
Core Clock |
Shader Clock |
Memory Clock |
Memory |
Interface |
| ATI Radeon HD5770 (Engineering Sample) |
800 |
850 |
N/A |
1200 |
1.0GB GDDR5 |
128-bit |
| XFX Radeon HD5830 (HD-583X-ZNFV) |
1120 |
800 |
N/A |
1000 |
1.0GB GDDR5 |
256-bit |
|
ASUS GeForce GTX 260 (ENGTX260 MATRIX) |
216 |
576 |
1242 |
999 |
896MB GDDR3 |
448-bit |
| MSI GeForce GTX 460 (N460GTX Cyclone 1GD5/OC) |
336 |
725 |
1450 |
900 |
1.0 GB GDDR5 |
256-bit |
|
MSI Radeon HD6870 (R6870-2PM2D1GD5) |
1120 |
900 |
N/A |
1050 |
1.0GB GDDR5 |
256-bit |
|
PowerColor Radeon HD 5870 (PCS+ AX5870 1GBD5-PPDHG2) |
1600 |
875 |
N/A |
1250 |
1.0GB GDDR5 |
256-bit |
Aliens vs. Predator Test Results
Rebellion, SEGA and Twentieth Century FOX have released the Aliens vs. Predator DirectX 11 Benchmark to the public. As with many of the already released DirectX 11 benchmarks, the Aliens vs. Predator DirectX 11 benchmark leverages your DirectX 11 hardware to provide an immersive game play experience through the use of DirectX 11 Tessellation and DirectX 11 Advanced Shadow features.

In Aliens vs. Predator, DirectX 11 Geometry Tessellation is applied in an effective manner to enhance and more accurately depict HR Giger's famous Alien design. Through the use of a variety of adaptive schemes, applying tessellation when and where it is necessary, the perfect blend of performance and visual fidelity is achieved with at most a 4% change in performance.
DirectX 11 hardware also allows for higher quality, smoother and more natural looking shadows as well. DirectX 11 Advanced Shadows allow for the rendering of high-quality shadows, with smoother, artifact-free penumbra regions, which otherwise could not be realized, again providing for a higher quality, more immersive gaming experience.
Benchmark Reviews is committed to pushing the PC graphics envelope, and whenever possible we configure benchmark software to its maximum settings for our tests. In the case of Aliens vs. Predator, all cards were tested with the following settings: Texture Quality-Very High, Shadow Quality-High, HW Tessellation & Advanced Shadow Sampling-ON, Multi Sample Anti-Aliasing-4x, Anisotropic Filtering-16x, Screen Space Ambient Occlusion (SSAO)-ON. You will see that this is a challenging benchmark, with all the settings turned up and a screen resolution of 1920 x 1200, as only the HD5870 cards achieved an average frame rate of 30FPS.
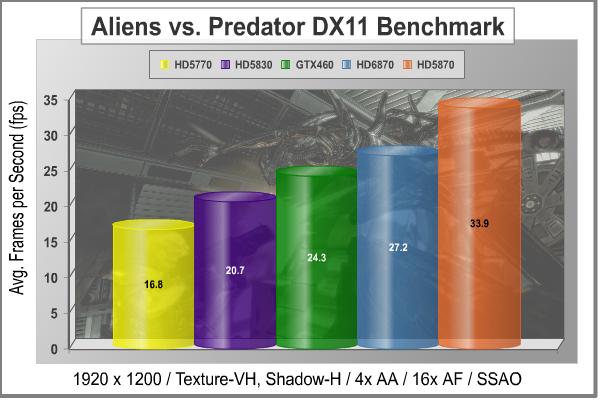
This is truly a DirectX 11 only benchmark, so we're limited to looking at only the latest generation cards. This is clearly a tough benchmark, and it's very useful for testing the latest and greatest graphics hardware. The ATI HD 5870, with a core clock of 875 MHz, beats everything yet just reaches 10% above 30 FPS as an average frame rate, using the latest drivers from AMD. When using anything less than the top hardware, some scenes had a jumpy quality to them. The overclocked MSI N460GTX Cyclone and the MSI R6870 pick up the second and third slots, no doubt due to their tessellation muscle.
In our next section, Benchmark Reviews looks at one of the newest and most popular games, Battlefield: Bad Company 2. The game lacks a dedicated benchmarking tool, so we'll be using FRAPS to measure frame rates within portions of the game itself.
|
Graphics Card |
Cores |
Core Clock |
Shader Clock |
Memory Clock |
Memory |
Interface |
| ATI Radeon HD5770 (Engineering Sample) |
800 |
850 |
N/A |
1200 |
1.0GB GDDR5 |
128-bit |
| XFX Radeon HD5830 (HD-583X-ZNFV) |
1120 |
800 |
N/A |
1000 |
1.0GB GDDR5 |
256-bit |
|
ASUS GeForce GTX 260 (ENGTX260 MATRIX) |
216 |
576 |
1242 |
999 |
896MB GDDR3 |
448-bit |
| MSI GeForce GTX 460 (N460GTX Cyclone 1GD5/OC) |
336 |
725 |
1450 |
900 |
1.0 GB GDDR5 |
256-bit |
|
MSI Radeon HD6870 (R6870-2PM2D1GD5) |
1120 |
900 |
N/A |
1050 |
1.0GB GDDR5 |
256-bit |
|
PowerColor Radeon HD 5870 (PCS+ AX5870 1GBD5-PPDHG2) |
1600 |
875 |
N/A |
1250 |
1.0GB GDDR5 |
256-bit |
Battlefield: Bad Company 2 Test Results
The Battlefield franchise has been known to demand a lot from PC graphics hardware. DICE (Digital Illusions CE) has incorporated their Frostbite-1.5 game engine with Destruction-2.0 feature set with Battlefield: Bad Company 2. Battlefield: Bad Company 2 features destructible environments using Frostbit Destruction-2.0, and adds gravitational bullet drop effects for projectiles shot from weapons at a long distance. The Frostbite-1.5 game engine used on Battlefield: Bad Company 2 consists of DirectX-10 primary graphics, with improved performance and softened dynamic shadows added for DirectX-11 users. At the time Battlefield: Bad Company 2 was published, DICE was also working on the Frostbite-2.0 game engine. This upcoming engine will include native support for DirectX-10.1 and DirectX-11, as well as parallelized processing support for 2-8 parallel threads. This will improve performance for users with an Intel Core-i7 processor.
In our benchmark tests of Battlefield: Bad Company 2, the first three minutes of action in the single-player raft night scene are captured with FRAPS. Relative to the online multiplayer action, these frame rate results are nearly identical to daytime maps with the same video settings.

The MSI R6870 puts in a very good performance with Battlefield: Bad Company 2, beating out the GTX460 and the HD 5830 easily and getting close to a 60 FPS frame rate. This is not as tough a benchmark as some others; the developers trod a fine line between juicing up the visuals and keeping the performance levels up. As much as people may Oooh and Aaah over some newer titles like Mafia II that have more exacting graphics, no one is complaining about the look and feel of BF:BC2. The maps are all loading at normal speed nowadays, too. This benchmark does not utilize tessellation, so as in our DX10 testing, the strength of the newest GPUs in this area are not having an impact here. Don't worry; we'll see some results later that will show clear differences between the generations with some tessellation-heavy titles.
Having expressed my appreciation for the balancing act that the company did with the graphic design, I have to mention that BF:BC2 has been playing some tricks on us lately. There is a little-documented feature in the basic setup that allows the game to choose which DirectX API it uses during the session. The default behavior is for the program to choose the highest mode that the current installed hardware supports. There are no options available in the user interface to choose manually, and no indication anywhere of which API is in use during game play. The problem is: we have been assuming that this is primarily a DX10 game, and benchmarking it accordingly. It actually switches back and forth between DX11, DX10 and DX9, depending on the capabilities of the installed graphics card.
There have been many examples in the literature about the performance "penalty" of DX10 compared to DX9, although they can be minimized in development. The problem has always been that there is no free lunch; you want added realism, you pay for it with extra GPU cycles, plain and simple. The same applies to DX11, although it has some efficiencies built into it that ease the load. The issue is that you have to do the development with DX11, you can't just bolt it on at the end and expect to gain all the benefits of the improved coding routines that were baked in by Microsoft. As BF:BC2 is cycled between the three DirectX APIs, keeping all the other settings the same, a card that forces the program to revert to DX10 mode has an advantage of between 10% and 20% better FPS. THIS is why my NVIDIA GT200 cards always did so well in this benchmark, compared to the ATI 5xxx series. They were running in DX10 mode and the ATI cards were running in DX11. Admittedly, there are only minimal DX11 features incorporated in BF:BC2, like softened shadows, but that one visual enhancement takes a measureable toll on frame rates.
In the next section we use one of my favorite games, DiRT-2, to look at DX11 performance. Life isn't ALL about shooting aliens; sometimes you just need to get out of the city and drive...!
|
Graphics Card |
Cores |
Core Clock |
Shader Clock |
Memory Clock |
Memory |
Interface |
| ATI Radeon HD5770 (Engineering Sample) |
800 |
850 |
N/A |
1200 |
1.0GB GDDR5 |
128-bit |
| XFX Radeon HD5830 (HD-583X-ZNFV) |
1120 |
800 |
N/A |
1000 |
1.0GB GDDR5 |
256-bit |
|
ASUS GeForce GTX 260 (ENGTX260 MATRIX) |
216 |
576 |
1242 |
999 |
896MB GDDR3 |
448-bit |
| MSI GeForce GTX 460 (N460GTX Cyclone 1GD5/OC) |
336 |
725 |
1450 |
900 |
1.0 GB GDDR5 |
256-bit |
|
MSI Radeon HD6870 (R6870-2PM2D1GD5) |
1120 |
900 |
N/A |
1050 |
1.0GB GDDR5 |
256-bit |
|
PowerColor Radeon HD 5870 (PCS+ AX5870 1GBD5-PPDHG2) |
1600 |
875 |
N/A |
1250 |
1.0GB GDDR5 |
256-bit |
DiRT-2 Demo DX11 Benchmark Results
DiRT-2 features a roster of contemporary off-road events, taking players to diverse and challenging real-world environments. This World Tour has players competing in aggressive multi-car, and intense solo races at extraordinary new locations. Everything from canyon racing and jungle trails to city stadium-based events. Span the globe as players unlock tours in stunning locations spread across the face of the world. USA, Japan, Malaysia, Baja Mexico, Croatia, London, and more venues await, as players climb to the pinnacle of modern competitive off-road racing.

Multiple disciplines are featured; encompassing the very best that modern off-roading has to offer. Powered by the third generation of the EGOTM Engine's award-winning racing game technology, DiRT-2 benefits from tuned-up car-handling physics and new damaged engine effects. It showcases a spectacular new level of visual fidelity, with cars and tracks twice as detailed as those seen in GRID. The DiRT-2 garage houses a collection of officially licensed rally cars and off-road vehicles, specifically selected to deliver aggressive and fast paced racing. Covering seven vehicle classes, players are given the keys to powerful vehicles right away. In DiRT-2 the opening drive is the Group N Subaru, essentially making the ultimate car from the original game the starting point in the sequel, and the rides just get even more impressive as you rack up points.

The primary contribution that DirectX-11 makes to the DiRT-2 Demo benchmark is in the way water is displayed when a car is passing through it, and in the way cloth items are rendered. The water graphics are pretty obvious, and there are several places in the Moroccan race scene where cars are plowing through large and small puddles. Each one is unique, and they are all believable, especially when more than one car is in the scene. The cloth effects are not as obvious, except in the slower-moving menu screens; when there is a race on, there's precious little time to notice the realistic furls in a course-side flag. I should also note that the flags are much more noticeable in the actual game than in the demo, so they do add a little more to the realism there, that is absent from the benchmark.
On a side note, I appreciate the fact that the demo's built-in benchmark has variable game play. I know its lame, but I most always watch it intently, just to see how well "my" car is being driven. So far, my finest telekinetic efforts have yielded a best finish of second place!
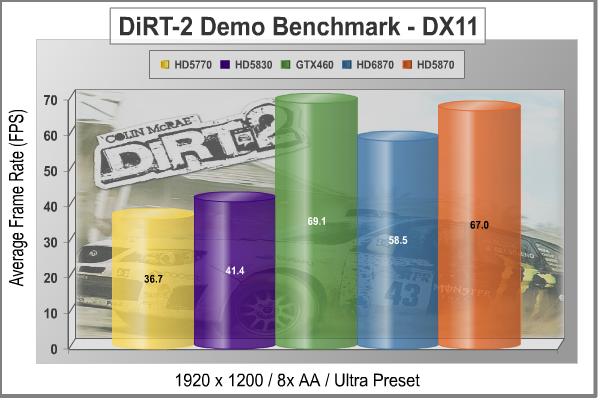
The relative performance of the Radeon HD 6870 in the DIRT-2 Demo is pretty consistent within the AMD family. With almost twice the frame rate as the 5770 "Juniper" card, and almost 50% better than the HD 5830, it's hard to argue that the HD 6870 doesn't deliver much better performance. It stays a respectable distance behind the 5870, and would be trading blows with the HD 5850 if it were in this test. The race winner is the GTX460, though. It surprises by beating out the HD 5870 at its own game. For a title that was developed on AMD hardware, this is a surprising result, or it would be if I hadn't already seen the GTX460 pick a fight with every high end card it encountered.
In the next section we'll take a look at one of the newest benchmarking tools, H.A.W.X. 2. It's a high flying aerial adventure filled with lots of tessellated terrain, blown-up airplane bits, and lots of blue sky as a background.
|
Graphics Card |
Cores |
Core Clock |
Shader Clock |
Memory Clock |
Memory |
Interface |
| ATI Radeon HD5770 (Engineering Sample) |
800 |
850 |
N/A |
1200 |
1.0GB GDDR5 |
128-bit |
| XFX Radeon HD5830 (HD-583X-ZNFV) |
1120 |
800 |
N/A |
1000 |
1.0GB GDDR5 |
256-bit |
|
ASUS GeForce GTX 260 (ENGTX260 MATRIX) |
216 |
576 |
1242 |
999 |
896MB GDDR3 |
448-bit |
| MSI GeForce GTX 460 (N460GTX Cyclone 1GD5/OC) |
336 |
725 |
1450 |
900 |
1.0 GB GDDR5 |
256-bit |
|
MSI Radeon HD6870 (R6870-2PM2D1GD5) |
1120 |
900 |
N/A |
1050 |
1.0GB GDDR5 |
256-bit |
|
PowerColor Radeon HD 5870 (PCS+ AX5870 1GBD5-PPDHG2) |
1600 |
875 |
N/A |
1250 |
1.0GB GDDR5 |
256-bit |
H.A.W.X. 2 DX11 Benchmark Results
H.A.W.X. 2 has been optimized for DX11 enabled GPUs and has a number of enhancements to not only improve performance with DX11 enabled GPUs but also greatly improve the visual experience while taking to the skies.
-
Level maps are 128 Km per dimension creating a level area of 16384 Km².
All of the terrain in this area is rendered using a powerful tessellation implementation. -
The game uses a hardware terrain tessellation method that allows a high number of detailed triangles to be rendered entirely on the GPU when near the terrain in question. This allows for a very low memory footprint and relies on the GPU power alone to expand the low res data to highly realistic detail.
-
Quad patches with multiple displacement maps aim to render 6-pixel-wide triangles typically creating 1.5 Million triangles per frame not including planes, trees, and buildings!
-
The game uses bi-cubic height filtering and fractal noise to give realistic detail at this grand scale. The wavelength and amplitude of the fractal noise is carefully tuned for maximum realism on each level working with the complex tessellation shaders to ensure highest level detail without cracks in the terrain surface.
-
These factors make H.A.W.X. 2 the perfect title for benchmarking the current and future generation of DX11 enabled GPUs.
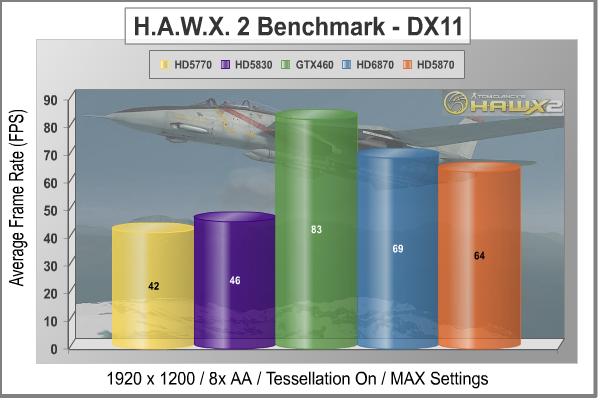
The H.A.W.X.2 benchmark test is not quite the tessellation monster that Unigine Heaven is. It is supposed to represent an actual game, after all. However, the developers have taken full advantage of the DirectX 11 technology to pump up the realism in this new title. The scenery on the ground in particular is very detailed and vividly portrayed, and there's a lot of it that goes by the window of the F-22 Raptor that is your point of view. The blue sky, not so much....
The enhanced ability of the newest GPU designs to handle tessellation is quite evident here. Both the Fermi and Barts GPU win the battle against the previous generation's high end card, the HD 5870. This benchmark was launched by NVIDIA and AMD had limited access during development, so I expect these numbers to shift a bit in the upcoming months as AMD updates their drivers.
Let's take a look at another DX11 benchmark, a fast-paced scenario on a Lost Planet called E.D.N. III. The dense vegetation in "Test A" is almost as challenging as it was in Crysis, and now we have tessellation and soft shadows thrown into the mix.
|
Graphics Card |
Cores |
Core Clock |
Shader Clock |
Memory Clock |
Memory |
Interface |
| ATI Radeon HD5770 (Engineering Sample) |
800 |
850 |
N/A |
1200 |
1.0GB GDDR5 |
128-bit |
| XFX Radeon HD5830 (HD-583X-ZNFV) |
1120 |
800 |
N/A |
1000 |
1.0GB GDDR5 |
256-bit |
|
ASUS GeForce GTX 260 (ENGTX260 MATRIX) |
216 |
576 |
1242 |
999 |
896MB GDDR3 |
448-bit |
| MSI GeForce GTX 460 (N460GTX Cyclone 1GD5/OC) |
336 |
725 |
1450 |
900 |
1.0 GB GDDR5 |
256-bit |
|
MSI Radeon HD6870 (R6870-2PM2D1GD5) |
1120 |
900 |
N/A |
1050 |
1.0GB GDDR5 |
256-bit |
|
PowerColor Radeon HD 5870 (PCS+ AX5870 1GBD5-PPDHG2) |
1600 |
875 |
N/A |
1250 |
1.0GB GDDR5 |
256-bit |
Lost Planet 2 DX11 Benchmark Results
A decade has passed since the first game, and the face of E.D.N. III has changed dramatically. Terra forming efforts have been successful and the ice has begun to melt, giving way to lush tropical jungles and harsh unforgiving deserts. Players will enter this new environment and follow the exploits of their own customized snow pirate on their quest to seize control of the changing planet.
-
4-player co-op action: Team up to battle the giant Akrid in explosive 4 player co-operative play. Teamwork is the player's key to victory as the team is dependent on each to succeed and survive.
-
Single-player game evolves based on players decisions and actions
-
Deep level of character customization: Players will have hundreds of different ways to customize their look to truly help them define their character on the battlefield both on- and offline. Certain weapons can also be customized to suit individual player style.
-
Beautiful massive environments: Capcom's advanced graphics engine, MT Framework 2.0, will bring the game to life with the next step in 3D fidelity and performance.
-
Massive scale of enemies: Players skill on the battlefield and work as a team will be tested like never before against the giant Akrid. Players will utilize teamwork tactics, new weapons and a variety of vital suits (VS) to fight these larger-than-life bosses.
-
Rewards System- Players will receive rewards for assisting teammates and contributing to the team's success
-
Multiplayer modes and online ranking system
-
Exciting new VS features- Based on fan feedback, the team has implemented an unbelievable variety of Vital Suits and new ways to combat VS overall. The new VS sytem will have a powerful impact on the way the player takes to the war zone in Lost Planet 2
Test A:
The primary purpose of Test A is to give an indication of typical game play performance of the PC running Lost Planet 2 (i.e. if you can run Mode A smoothly, the game will be playable at a similar condition). In this test, the character's motion is randomized to give a slightly different outcome each time.
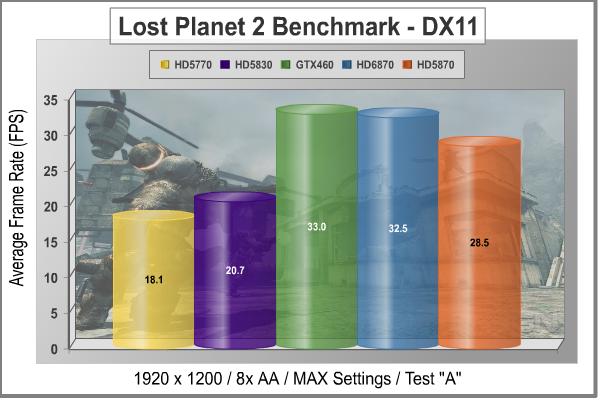
In Test A of Lost Planet 2, we see a familiar pattern. That is, the newest games are implementing the latest software technology and the newest graphics cards are optimized to handle exactly that. I'm sure there will be further optimizations as time marches on, but right now we have an almost ideal gaming environment where the software and hardware are finally in sync. As long as you are happy with the story lines, characters, scoring systems, etc. of the new games, you can enjoy a level of realism and performance that was only hinted at with the first generation of DX11 software and hardware. I keep thinking of some of the early titles as "tweeners", as they were primarily developed using the DirectX 10 graphics API, and then some DX11 features were added right before the product was released. It was a nice glimpse into the technology, but the future is now.
The full results for the MSI R6870 are: 34-23-34 for scenes one through three of this benchmark. Scene two is almost always the most demanding, no matter what card is installed. In fact it's usually tougher than Test B. For simplicity's sake, we are reporting the average result, as calculated by the benchmark application. It is not an average of the individual scores reported for the three scenes. The other familiar pattern we see here is the GTX460 running really exceptionally well with any of the newer games that feature significant amounts of tessellation.
Test B:
The primary purpose of Test B is to push the PC to its limits and to evaluate the maximum performance of the PC. It utilizes many functions of Direct X11 resulting in a very performance-orientated, very demanding benchmark mode.
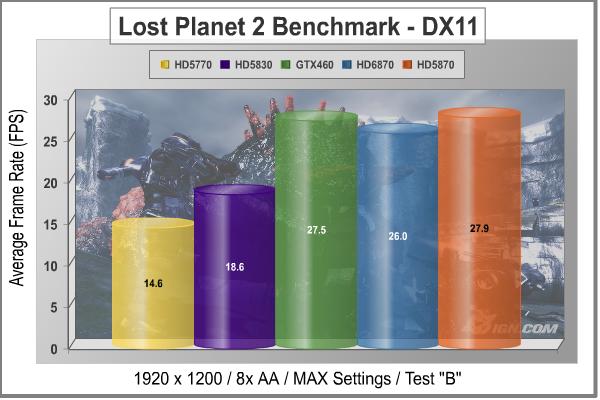
Test B shows a similar ranking as Test A, but the HD 5870 makes a bit of a comeback. The sea monster (I can't quite say "River Monster" for some reason...) is a prime candidate for tessellation, and given the fact that it is in the foreground for most of the scene, the full level of detail is usually being displayed. The water effects also contribute to the graphics load in this test, making it just a little bit tougher than Test A. The fact that the GTX460 is within half an FPS of the HD 5870 implies that the tessellation load is still the dominant factor in determining overall frame rate performance in this game.
Let's take a look at one more DX11 gaming benchmark. This time, it's a wonderful blend of modern graphics technology and classic crime scenes, called Mafia II.
|
Graphics Card |
Cores |
Core Clock |
Shader Clock |
Memory Clock |
Memory |
Interface |
| ATI Radeon HD5770 (Engineering Sample) |
800 |
850 |
N/A |
1200 |
1.0GB GDDR5 |
128-bit |
| XFX Radeon HD5830 (HD-583X-ZNFV) |
1120 |
800 |
N/A |
1000 |
1.0GB GDDR5 |
256-bit |
|
ASUS GeForce GTX 260 (ENGTX260 MATRIX) |
216 |
576 |
1242 |
999 |
896MB GDDR3 |
448-bit |
| MSI GeForce GTX 460 (N460GTX Cyclone 1GD5/OC) |
336 |
725 |
1450 |
900 |
1.0 GB GDDR5 |
256-bit |
|
MSI Radeon HD6870 (R6870-2PM2D1GD5) |
1120 |
900 |
N/A |
1050 |
1.0GB GDDR5 |
256-bit |
|
PowerColor Radeon HD 5870 (PCS+ AX5870 1GBD5-PPDHG2) |
1600 |
875 |
N/A |
1250 |
1.0GB GDDR5 |
256-bit |
Mafia II DX11 Benchmark Results
Mafia II is a single-player third-person action shooter developed by 2K Czech for 2K Games, and is the sequel to Mafia: The City of Lost Heaven released in 2002. Players assume the life of World War II veteran Vito Scaletta, the son of small Sicilian family who immigrates to Empire Bay. Growing up in the slums of Empire Bay teaches Vito about crime, and he's forced to join the Army in lieu of jail time. After sustaining wounds in the war, Vito returns home and quickly finds trouble as he again partners with his childhood friend and accomplice Joe Barbaro. Vito and Joe combine their passion for fame and riches to take on the city, and work their way to the top in Mafia II.
Mafia II is a DirectX-9/10/11 compatible PC video game built on 2K Czech's proprietary Illusion game engine, which succeeds the LS3D game engine used in Mafia: The City of Lost Heaven. In our Mafia-II Video Game Performance article, Benchmark Reviews explored characters and gameplay while illustrating how well this game delivers APEX PhysX features on both AMD and NVIDIA products. Thanks to DirectX-11 APEX PhysX extensions that can be processed by the system's CPU, Mafia II offers gamers equal access to high-detail physics regardless of video card manufacturer. Equal access is not the same thing as equal performance, though.
With PhysX technology turned off, both AMD and NVIDIA are on a level playing field in this test. In contrast to many gaming scenes, where other-worldly characters and environments allow the designers to amp up the detail, Mafia II uses human beings wearing ordinary period-correct clothes and natural scenery. Just like how high end audio equipment is easiest to judge using that most familiar of sounds - the human voice, graphics hardware is really put to the test when rendering things that we have real experience with. The drape of a wool overcoat is a deceptively simple construct; easy to understand and implement, but very difficult to get perfect.
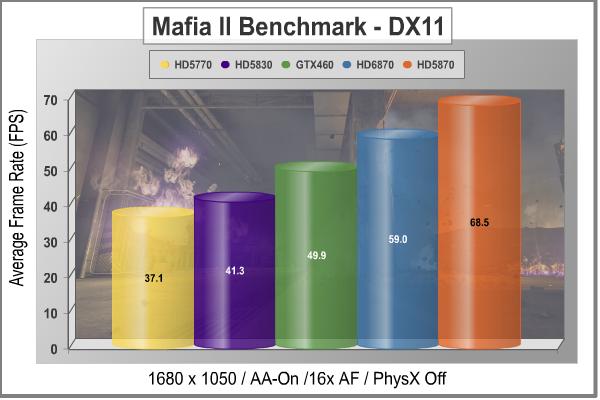
The MSI R6870 did very well in this medium-resolution benchmark, with an average frame rate of 59, almost ten FPS higher than the GTX460. By arranging the cards in price-order, from left to right in the chart, you expect the bars to rise evenly as you progress up the pricing ladder. The fact that they do so in such a linear manner in this test indicates to me that this game is equally suited to either AMD or NVIDIA solutions. Given the fact that Mafia II makes excellent use of PhysX and 3D as described in our NVIDIA APEX PhysX Efficiency: CPU vs GPU article, both areas where NVIDIA has an edge, some of you are probably howling at that statement. But an 18% improvement in performance for a 9% increase in price is a good deal. The law of diminishing returns usually has those two numbers reversed when comparing midrange or upper range products in any field.

At the higher screen resolution of 1920x1200, the MSI R6870 beats an overclocked GTX460 by exactly 25%, with an average frame rate of 48.5 FPS. I think it's fair to say that Mafia II relies less on tessellation for enhancing realism than it does on PhysX. Otherwise, the newer, better tessellation engines in the HD 6870 and the GTX460 would be pushing those numbers up, relative to the HD 5870. Here is a game where brute force, meaning the number of shader processors, pays off.
In our next section, we are going to complete our DirectX 11 testing with a look at an unusual DX11 benchmarks, straight from Russia and the studios of Unigine. Their latest benchmark is called "Heaven", and it has some very interesting and non-typical graphics. So, let's take a peek at what Heaven v2.1 looks like.
|
Graphics Card |
Cores |
Core Clock |
Shader Clock |
Memory Clock |
Memory |
Interface |
| ATI Radeon HD5770 (Engineering Sample) |
800 |
850 |
N/A |
1200 |
1.0GB GDDR5 |
128-bit |
| XFX Radeon HD5830 (HD-583X-ZNFV) |
1120 |
800 |
N/A |
1000 |
1.0GB GDDR5 |
256-bit |
|
ASUS GeForce GTX 260 (ENGTX260 MATRIX) |
216 |
576 |
1242 |
999 |
896MB GDDR3 |
448-bit |
| MSI GeForce GTX 460 (N460GTX Cyclone 1GD5/OC) |
336 |
725 |
1450 |
900 |
1.0 GB GDDR5 |
256-bit |
|
MSI Radeon HD6870 (R6870-2PM2D1GD5) |
1120 |
900 |
N/A |
1050 |
1.0GB GDDR5 |
256-bit |
|
PowerColor Radeon HD 5870 (PCS+ AX5870 1GBD5-PPDHG2) |
1600 |
875 |
N/A |
1250 |
1.0GB GDDR5 |
256-bit |
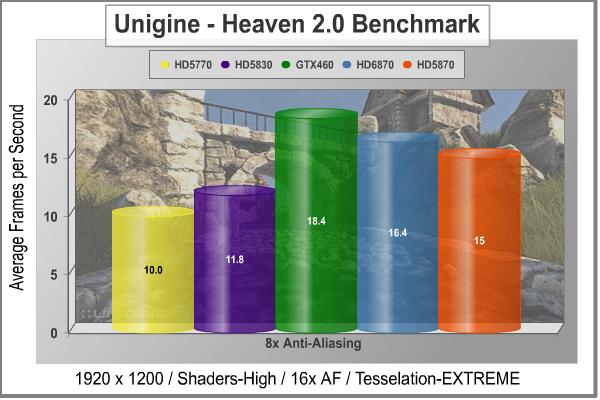
Unigine Heaven 2.1 Benchmark
The Unigine "Heaven 2.1" benchmark is a free, publicly available, tool that grants the power to unleash the graphics capabilities in DirectX 11 for Windows 7 or updated Vista Operating Systems. It reveals the enchanting magic of floating islands with a tiny village hidden in the cloudy skies. With the interactive mode, emerging experience of exploring the intricate world is within reach. Through its advanced renderer, Unigine is one of the first to set precedence in showcasing the art assets with tessellation, bringing compelling visual finesse, utilizing the technology to the full extend and exhibiting the possibilities of enriching 3D gaming.
The distinguishing feature in the Unigine Heaven benchmark is a hardware tessellation that is a scalable technology aimed for automatic subdivision of polygons into smaller and finer pieces, so that developers can gain a more detailed look of their games almost free of charge in terms of performance. Thanks to this procedure, the elaboration of the rendered image finally approaches the boundary of veridical visual perception. The "Heaven" benchmark excels at the following key features:
- Native support of OpenGL, DirectX 9, DirectX-10 and DirectX-11
- Comprehensive use of tessellation technology
- Advanced SSAO (screen-space ambient occlusion)
- Volumetric cumulonimbus clouds generated by a physically accurate algorithm
- Dynamic simulation of changing environment with high physical fidelity
- Interactive experience with fly/walk-through modes
- ATI Eyefinity support

Starting off with a lighter load of 4x MSAA, we see a virtual tie between the GTX460 and the R6870 and a very slight lead by the Radeon HD 5870. Even in the "normal" tessellation mode, this is a graphics test that really shows off the full impact of this DirectX 11 technology. The Fermi architecture has so much more computing power designated and available for tessellation, that it's no small surprise to see the card doing so well here. The same goes for the HD 6870, its revamped tessellation engine puts it within striking distance of the HD 5870, even though it only has the same number of shaders as the 5830, which is well off the pace. There is still a small amount of jerkiness to the display with all of the cards at this resolution; now that I've seen the landscape go by for a couple hundred times, I can spot the small stutters more easily. This test was run with 4x anti-aliasing; let's see how the cards stack up when we increase MSAA to the maximum level of 8x.

Increasing the anti-aliasing just improved the already convincing performance of the MSI N460GTX Cyclone, relative to the Radeon HD series of cards. There's no denying that the Fermi chip, in its best interpretation yet: the GF104, is a killer when called upon for tessellation duty. The MSI R6870 hangs in there, relative to the HD 5870; it's just the GTX460 that gets the extra boost at these settings.
One more test...one that's a little unusual, just to satisfy my curiosity. Heaven v2.0 was released at the same time as the first Fermi GPUs. Unigine added the "Extreme" selection for the tessellation setting, some say to show off the unique architecture of Fermi. Test results clearly showed a huge advantage for the NVIDIA GPUs when this setting was used. The general consensus was that the code was written specifically for the GF100 chip, and that it would be next to impossible for any ATI GPU to perform at comparable levels, unless they abandoned their current architecture and followed the NVIDIA design. It's time to test that theory; AMD has reworked the tessellation engine in the HD 6xxx GPUs, and is claiming a 2X improvement in performance. Let's see how that works out in what I will assume is a hostile benchmark environment.
The results show some improvement in tessellation from the HD5xxx cards to the HD6XXX series, but not close to 2X in this test. The Fermi GPU walks away with top place again, and I think it's still fair to say that this setting remains best suited for only testing one Fermi card against another. Other DX11 benchmarks which have heavy doses of tessellation, HAWX2 or Lost Planet 2, also give some measure of preference to the NVIDIA architecture, but not to this extent. Some DirectX 11 titles, like S.T.A.L.K.E.R. CoP and Battlefield: Bad Company 2 never behaved this way, since the application of tessellation in those titles was very minimal or absent.
In our next section, we investigate the thermal performance of the MSI R6870-2PM2D1GD5, and see how well the reference cooler works on the latest Radeon offering.
|
Graphics Card |
Cores |
Core Clock |
Shader Clock |
Memory Clock |
Memory |
Interface |
| ATI Radeon HD5770 (Engineering Sample) |
800 |
850 |
N/A |
1200 |
1.0GB GDDR5 |
128-bit |
| XFX Radeon HD5830 (HD-583X-ZNFV) |
1120 |
800 |
N/A |
1000 |
1.0GB GDDR5 |
256-bit |
|
ASUS GeForce GTX 260 (ENGTX260 MATRIX) |
216 |
576 |
1242 |
999 |
896MB GDDR3 |
448-bit |
| MSI GeForce GTX 460 (N460GTX Cyclone 1GD5/OC) |
336 |
725 |
1450 |
900 |
1.0 GB GDDR5 |
256-bit |
|
MSI Radeon HD6870 (R6870-2PM2D1GD5) |
1120 |
900 |
N/A |
1050 |
1.0GB GDDR5 |
256-bit |
|
PowerColor Radeon HD 5870 (PCS+ AX5870 1GBD5-PPDHG2) |
1600 |
875 |
N/A |
1250 |
1.0GB GDDR5 |
256-bit |
MSI R6870 Temperatures
It's hard to know exactly when the first video card got overclocked, and by whom. What we do know is that it's hard to imagine a computer enthusiast or gamer today that doesn't overclock their hardware. Of course, not every video card has the head room. Some products run so hot that they can't suffer any higher temperatures than they generate straight from the factory. This is why we measure the operating temperature of the video card products we test.
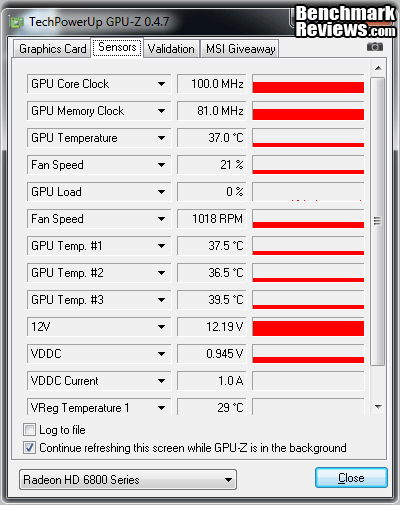
To begin testing, I use GPU-Z to measure the temperature at idle as reported by the GPU. Next I use FurMark 1.8.2 to generate maximum thermal load and record GPU temperatures at high-power 3D mode. The ambient room temperature remained stable at 23C throughout testing. I was lucky to have some nice weather during testing, since my testing is done in an upstairs room that doesn't get as much of the central A/C as I would like. I do have a ton of airflow into the video card section of my benchmarking case, with a 200mm side fan blowing directly inward, so that helps alleviate any high ambient temps.
The MSI R6870 video card recorded 36C in idle mode, and increased to 72C after 30 minutes of stability testing in full 3D mode, at 1920x1200 resolution, and the maximum MSAA setting of 8X. With the fan set on Automatic, the speed only rose to 31% under full load. That was such a low fan speed and a high temperature, that I immediately did a run with manual fan control and 100% fan speed. I was rewarded by the noise of a hair dryer and a greatly reduced load temperature of 54C.
|
Load |
Fan Speed |
GPU Temperature |
|
Idle |
21% - AUTO (1011 RPM) |
36C |
|
Furmark |
31% - AUTO (1870 RPM) |
72C |
|
Furmark |
100% - Manual (4475 RPM) |
54C |
72C is not a very good result for temperature stress testing, in my opinion. I've become used to seeing video card manufacturers keeping the fan speeds low, especially with the type of radial blower wheel that this reference design uses. In this case, the fan controller barely ramped up from the idle speed of 21% to the 31% mark when running at full load on auto. Obviously, AMD is trying to minimize normal operating noise while retaining a lot of headroom in case things go south inside the PC case. There is definitely some thermal benefit to running the fan harder, as you can see from the 100% fan results above, but the noise is overbearing at full tilt. I expect a lot of users will make use of custom software profiles to control the fan on their HD6870 reference design.
For me, this type of fan noise is more irritating than what an axial fan produces, so I understand why AMD is trying to keep the fan speed down as low as possible. I prefer a video card that pushes all the heated air out the back of the case, and that almost forces the use of the radial blower, so I guess I shouldn't be surprised by the noise performance of this cooling design.

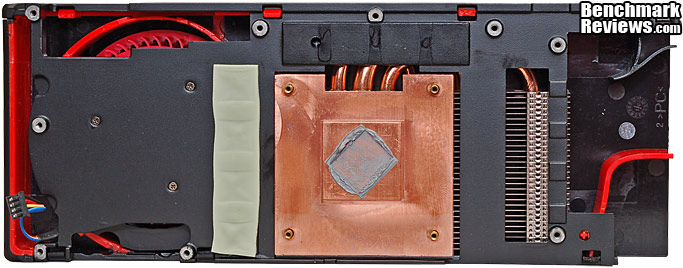
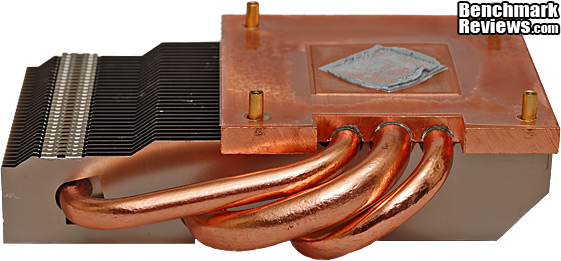
Load temps got up to 69C when running continuous gaming benchmarks with automatic fan speeds, ramping up to 30% with the most challenging titles. This is closer to stress-test-maximum than any other card I've tested, which tells me that this is the operating temperature range that AMD has selected for this GPU. It's higher than I like to see, and I don't think it bodes well for overclocking, but ultimately AMD gets to pick the operating point. I think this also explains why they used such a thick block of copper on the GPU heatsink. That gives the cooling system the ability to absorb and dampen out temperature spikes far better than a design that uses a thin layer of copper to transfer the heat to the heatpipes and aluminum fins.
FurMark is an OpenGL benchmark that heavily stresses and overheats the graphics card with fur rendering. The benchmark offers several options allowing the user to tweak the rendering: fullscreen / windowed mode, MSAA selection, window size, duration. The benchmark also includes a GPU Burner mode (stability test). FurMark requires an OpenGL 2.0 compliant graphics card with lot of GPU power!

FurMark does do two things extremely well: drive the thermal output of any graphics processor higher than any other application or video game, and it does so with consistency every time. While FurMark is not a true benchmark tool for comparing different video cards, it still works well to compare one product against itself using different drivers or clock speeds, or testing the stability of a GPU, as it raises the temperatures higher than any program. But in the end, it's a rather limited tool.
In our next section, we discuss electrical power consumption and learn how well (or poorly) each video card will impact your utility bill...
VGA Power Consumption
Life is not as affordable as it used to be, and items such as gasoline, natural gas, and electricity all top the list of resources which have exploded in price over the past few years. Add to this the limit of non-renewable resources compared to current demands, and you can see that the prices are only going to get worse. Planet Earth is needs our help, and needs it badly. With forests becoming barren of vegetation and snow capped poles quickly turning brown, the technology industry has a new attitude towards turning "green". I'll spare you the powerful marketing hype that gets sent from various manufacturers every day, and get right to the point: your computer hasn't been doing much to help save energy... at least up until now. Take a look at the idle clock rates that AMD programmed into the BIOS for this GPU; no special power-saving software utilities are required.
To measure isolated video card power consumption, I used the Kill-A-Watt EZ (model P4460) power meter made by P3 International. A baseline test is taken without a video card installed inside our computer system, which is allowed to boot into Windows and rest idle at the login screen before power consumption is recorded. Once the baseline reading has been taken, the graphics card is installed and the system is again booted into Windows and left idle at the login screen. Our final loaded power consumption reading is taken with the video card running a stress test using FurMark. Below is a chart with the isolated video card power consumption (not system total) displayed in Watts for each specified test product:
VGA Product Description(sorted by combined total power) |
Idle Power |
Loaded Power |
|---|---|---|
NVIDIA GeForce GTX 480 SLI Set |
82 W |
655 W |
NVIDIA GeForce GTX 590 Reference Design |
53 W |
396 W |
ATI Radeon HD 4870 X2 Reference Design |
100 W |
320 W |
AMD Radeon HD 6990 Reference Design |
46 W |
350 W |
NVIDIA GeForce GTX 295 Reference Design |
74 W |
302 W |
ASUS GeForce GTX 480 Reference Design |
39 W |
315 W |
ATI Radeon HD 5970 Reference Design |
48 W |
299 W |
NVIDIA GeForce GTX 690 Reference Design |
25 W |
321 W |
ATI Radeon HD 4850 CrossFireX Set |
123 W |
210 W |
ATI Radeon HD 4890 Reference Design |
65 W |
268 W |
AMD Radeon HD 7970 Reference Design |
21 W |
311 W |
NVIDIA GeForce GTX 470 Reference Design |
42 W |
278 W |
NVIDIA GeForce GTX 580 Reference Design |
31 W |
246 W |
NVIDIA GeForce GTX 570 Reference Design |
31 W |
241 W |
ATI Radeon HD 5870 Reference Design |
25 W |
240 W |
ATI Radeon HD 6970 Reference Design |
24 W |
233 W |
NVIDIA GeForce GTX 465 Reference Design |
36 W |
219 W |
NVIDIA GeForce GTX 680 Reference Design |
14 W |
243 W |
Sapphire Radeon HD 4850 X2 11139-00-40R |
73 W |
180 W |
NVIDIA GeForce 9800 GX2 Reference Design |
85 W |
186 W |
NVIDIA GeForce GTX 780 Reference Design |
10 W |
275 W |
NVIDIA GeForce GTX 770 Reference Design |
9 W |
256 W |
NVIDIA GeForce GTX 280 Reference Design |
35 W |
225 W |
NVIDIA GeForce GTX 260 (216) Reference Design |
42 W |
203 W |
ATI Radeon HD 4870 Reference Design |
58 W |
166 W |
NVIDIA GeForce GTX 560 Ti Reference Design |
17 W |
199 W |
NVIDIA GeForce GTX 460 Reference Design |
18 W |
167 W |
AMD Radeon HD 6870 Reference Design |
20 W |
162 W |
NVIDIA GeForce GTX 670 Reference Design |
14 W |
167 W |
ATI Radeon HD 5850 Reference Design |
24 W |
157 W |
NVIDIA GeForce GTX 650 Ti BOOST Reference Design |
8 W |
164 W |
AMD Radeon HD 6850 Reference Design |
20 W |
139 W |
NVIDIA GeForce 8800 GT Reference Design |
31 W |
133 W |
ATI Radeon HD 4770 RV740 GDDR5 Reference Design |
37 W |
120 W |
ATI Radeon HD 5770 Reference Design |
16 W |
122 W |
NVIDIA GeForce GTS 450 Reference Design |
22 W |
115 W |
NVIDIA GeForce GTX 650 Ti Reference Design |
12 W |
112 W |
ATI Radeon HD 4670 Reference Design |
9 W |
70 W |
The MSI R6870-2PM2D1GD5 pulled just 20 (142-122) watts at idle and 185 (307-122) watts when running full out, using the test method outlined above. The HD6870 is more frugal than the prior generation of midrange Radeons. Hopefully, AMD has fixed the idle frequency problems that plagued the HD5xxx series, especially in CrossFireX mode. In idle mode, the BIOS needs to run the clocks WAY down, without any ill effects. We've become used to the low power ways of the newest processors, and there's no turning back. BTW, just because you asked....my card reported a GPU voltage of 0.945V at idle, 1.094V in 2D mode, and 1.172V in full 3D mode.
Next, I'll offer you some final thoughts, and my conclusions. On to the next page...
AMD Radeon HD 6870 Final Thoughts
Every now and then, companies manage to pull a rabbit out of a hat. I don't know exactly how they do it, or else I'd be rich and famous, but I believe its equal parts chance and effort. I know that runs counter to the words of the great Thomas Edison, who certainly pulled out a few rabbits in his day. As a product reviewer, nothing makes us happier than having said rabbit delivered to our door via FedEx. It's great when you can be a material witness to the impossible dream. It's exciting, and it's contagious; everyone wants in on the act. Every time I get a new product to evaluate, I ask myself if this thing looks like a rabbit or a tortoise. Sorry to mix my metaphors, but a great deal of progress is also made by products that move down the playing field ten yards at a time. I have a lot of respect for those products because sometimes it's tougher to make the next first down than it is to make a touchdown.
By now, the story is perfectly crystallized: Barts, as in St. Barts, is an incremental product. Taiwan Semiconductor Manufacturing Company (TSMC) failed to deliver the 32nm technology node to its customers on time, and at some point they just gave up and decided to skip it altogether, leaving some major customers with a real problem on their hands. The holiday buying season waits for no man, so AMD punted and took what they knew about the 40nm fabrication process back to the drawing board. They had used very conservative design rules for their Radeon HD 5xxx series of GPUs, and with one year of production under their belt they knew where they could stretch the rules a bit and get away with it. They also knew that they had left a gaping hole in their product line at the upper end of the mid-market. So, they bit the bullet and renumbered the product line to slot some new cards in the gap that the HD 5830 had failed to fill. Just like that, the HD 6870 was created, or at least the concept for it.
As I said in my reviews of the GTX460, that chip is really comparable to an HD 5850 from a technology standpoint, and NVIDIA chose to sell it at a price point that was occupied by a lesser model, the HD 5830. Sounds like a good marketing plan, especially since every Cypress-based card and every GF104-based card share the same cost structure. That cost is based strictly on the technology node, the manufacturing platform used to produce it, and the size of the die. Sure, you can add or subtract features, but the fundamental production costs are comparable for both chips, even if the performance is not. At the time I thought, "All ATI needs to do is lower prices on their midrange cards, and the compelling case of the GTX460 just goes away." Well, AMD has gone one better. Not only have they reduced the selling price for 5850-class performance, they've also reduced their production costs by achieving the same level of performance with a GPU die size that's about 30% smaller than a Cypress or GF104.

When NVIDIA designed the GTX460 reference card, they went for the simplest design and lowest part count in order to keep the cost down. I don't see the same thinking with the Radeon HD 6870. To me, it looks more like a "halo" product; one that is meant to impress. I am definitely NOT the marketing guy, but I thought that role was reserved for the high-end product line. It's still early days, and we'll have to see if and when the price drops come, and by how much. Once the non-reference cards come out, I think we'll see some serious price drops. The GPU itself has a 30% cost advantage over the Cypress part, but the rest of the HD 6870 reference design hasn't been pared down to match it. The other thing that hurts the HD 6870 is the current lack of a widespread capability for voltage adjustments. Without it, the Barts GPU is running very close to its speed limit, and there seems to be little room available for overclocking. The GTX460 came out of the gate with full voltage adjustments, and MSI was leading the OC way, even without an I2C-capable PWM controller on board. I know there's at least one third-party voltage control app that works with the HD 6870, and I've also seen overclocking results way above 1.0 GHz with water cooling. So, there is probably some untapped potential here to convincingly outperform the crowd of overclocked GTX460s that are nipping at its heels. I'm betting that the HD 6870 will get some legs once the voltages are unlocked. Until then, it's not really a fair fight.
MSI R6870 Conclusion
From a performance standpoint, this is a 5850-class card with the potential to cost 30% less. It convincingly distances itself from the Radeon HD 5830, which used to occupy this price point. In stock form, it competes well with sanely overclocked GTX460 cards, and I'm going to wait for voltage control to be widely supported before I pass judgment on its full potential. Until then, I can only say that it is a capable performer, and it fills the large performance gap AMD had in the product line. I'm not too thrilled with the cooling solution, due to the noise factor and the weak fan profile that seems to cap the fan speed below 33%, barring some catastrophic condition. All this leads to higher operating temperatures than I like to see during normal gaming scenarios.
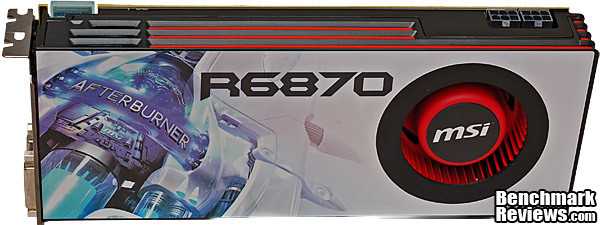
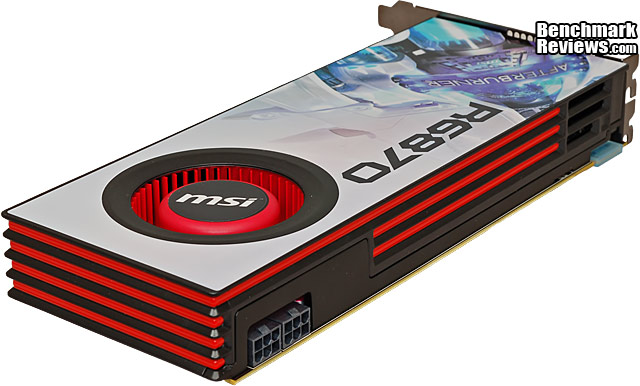
The appearance of the MSI R6870 video card is very attractive; a cool clean block of performance. I said earlier, that I thought this card was much too nice for a midrange offering. The mix of metal and plastic in the shroud gives a definite sense of solidity, and the decorative touches are subtle and refined. MSI's choice of graphic for the full-width sticker is refreshing, with the light color providing some balance to the rest of the black metal and plastic.

The build quality of the MSI N460GTX HAWK card was impressive, too good perhaps for the price-sensitive mid market. Everything is assembled well, everything fit when I put it back together, and the overall impression of the card was very solid. The cooler adds a certain metallic heft to the card and also lends a good deal of solidity to the product. The packaging was high quality and very informative. I was not equally impressed by the PC board, which still had too much residue from the wave solder/cleaning process for my liking. The unique power supply arrangement used all high quality parts, and is a leading-edge design in its use of the latest components.
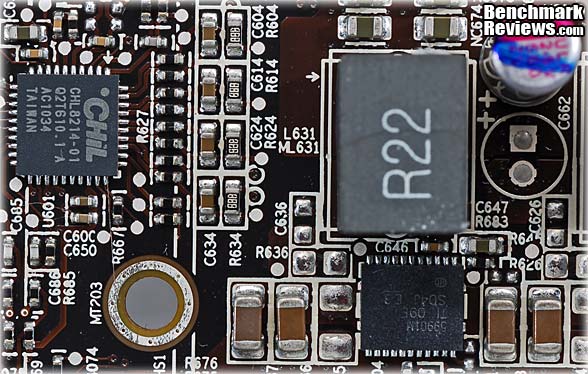
I continue to give top marks to the new MSI Afterburner software. Although the full scope of voltage adjustment is missing at this time, I have no doubt it will make an appearance soon. The user interface alone could put this free, bundled software at the top of the heap. There are other tools available which will work on this reference hardware, but compatibility is still a little sketchy with the primary voltage regulator.
The basic features of the MSI R6870 are mostly comparable with the latest offerings from both camps, but it lacks PhysX Technology, which is a real disappointment for some. The big news on the feature front is the new Morphological Anti-aliasing, the two DisplayPort 1.2 connections that support four monitors between them, 3rd generation UVD video acceleration, and AMD HD3D technology. That's quite a handful of new technologies to introduce at one time, and proof that it takes more than raw processing power to win over today's graphics card buyer.
As of early October 2010, the price for the MSI R6870-2PM2D1GD5 is $257.99 at Amazon or $269.99 at NewEgg. This where that "better than I really thought necessary" construction quality comes home to roost. I definitely appreciate the mechanical design and implementation, but they don't serve to increase performance, which is where I'd rather see the money spent. The asking price is an even $10 more than the average HD 6870 card, and there are no incentives included at this time. I would gladly pay two to three times that $10 premium for a Twin Frozr version of this card, but for a reference card, I would think twice. I'm betting that when MSI Afterburner supports the reference design, it will work with any manufacturer's reference card, but I can only guess at this point. If the card had some unique, hardware-specific features that were accessible only through Afterburner, that would definitely add value.
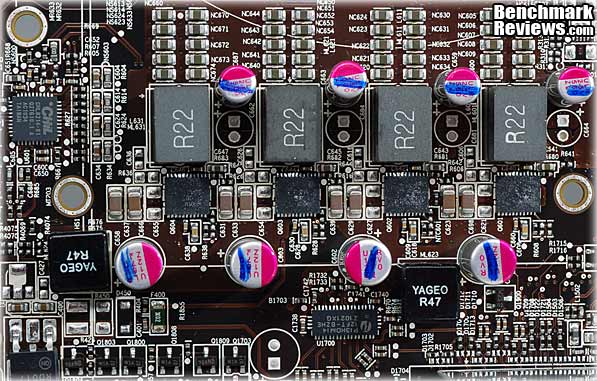
I like this card, because it takes the best of the Radeon HD 5770 and the HD 5850 and creates a lower cost version that equals the old high-priced spread. I'm a power supply junkie (because I build audio amps for fun...), and AMD did an unusual about face on this design. They used components and technologies that really pull their weight in terms of increasing performance, and didn't add any unnecessary complexity that could come back to bite them. They dumped their creativity into solving the VRM cooling problem with a simple and effective relocation plan. Without some reliable way of increasing core voltage, the HD 6870 can't smack around the GTX460 like I know AMD would like it too, but that day may come soon. One day someone will invent a silent radial blower; until then, I will prefer cooler designs that use an axial fan. The exhaust fans on my PC case do a great job at removing hot air, negating the only real reason I see for sticking with this design.
The bottom line for me is: although I've seen some pretty awesome GTX460 cards in the last few months, I think the R6870 is a viable alternative. It doesn't push the NVIDIA offering aside, and it never will at its current price, but a month ago there was only one really good choice in the upper midrange. Now there are two.
Pros:
+ 5850 performance levels at lower cost
+ Lower power than HD 5xxx, especially at idle
+ The VRM heat problem is fixed for good
+ Good price/performance ratio
+ Excellent mechanical design and construction
+ Flexible output connections
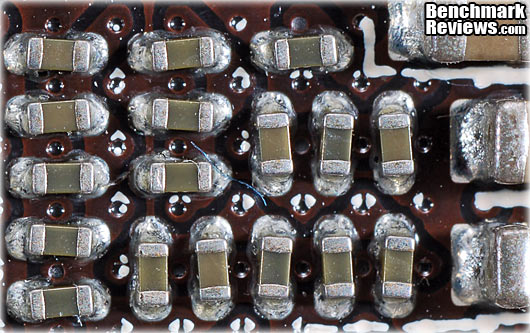
+ Memory ICs are actively cooled
+ Most heat exits case directly
+ Afterburner support (coming)
Cons:
- Tessellation performance still lags behind Fermi
- Low overclocking headroom at stock voltage
- Default fan profile too slow for an enthusiast card
- Afterburner SW doesn't support I2C-based PWM controller yet
- Radial blower is still too noisy for the cooling performance
- Mafia II without PhysX just isn't the same...
Ratings:
- Performance: 9.00
- Appearance: 8.75
- Construction: 9.50
- Functionality: 9.25
- Value: 8.25
Final Score: 8.95 out of 10.
Quality Recognition: Benchmark Reviews Silver Tachometer Award.
Questions? Comments? Benchmark Reviews really wants your feedback. We invite you to leave your remarks in our Discussion Forum.
Related Articles:
- Olevia/Syntax 242T FHD 42-Inch LCD 1080p HDTV
- Intel Core i7-870 Processor BX80605I7870
- Razer Orochi USB/Bluetooth Mobile Gaming Mouse
- Antec TruePower Quattro 850W Modular PSU TPQ-850
- Thrustmaster Dual Trigger 3-in-1 Rumble Force Gamepad
- AMD Radeon HD 6970 Video Card
- Rosewill Blackhawk-Ultra HPTX Computer Case
- Benchmark Reviews Editors Choice Awards 2008
- Mionix Naos 3200 USB Optical Gaming Mouse
- NZXT Whisper Full-Tower Computer Case

Comments
Now I just have to decide whether to go with this or wait until the Caymans come out. They just got pushed back again tho... from end of November to mid December. =/
Once again, Great review!!! Really in depth and exactly what I was looking for.
-Crazy